
Diagrammix is the most efficient business tool for chart creation and illustration purposes, available exclusively on the Apple Mac.
If you are an office worker, developer, manager, supervisor, student or home user you can use Diagrammix to draw almost anything in an extremely simple and intuitive way.
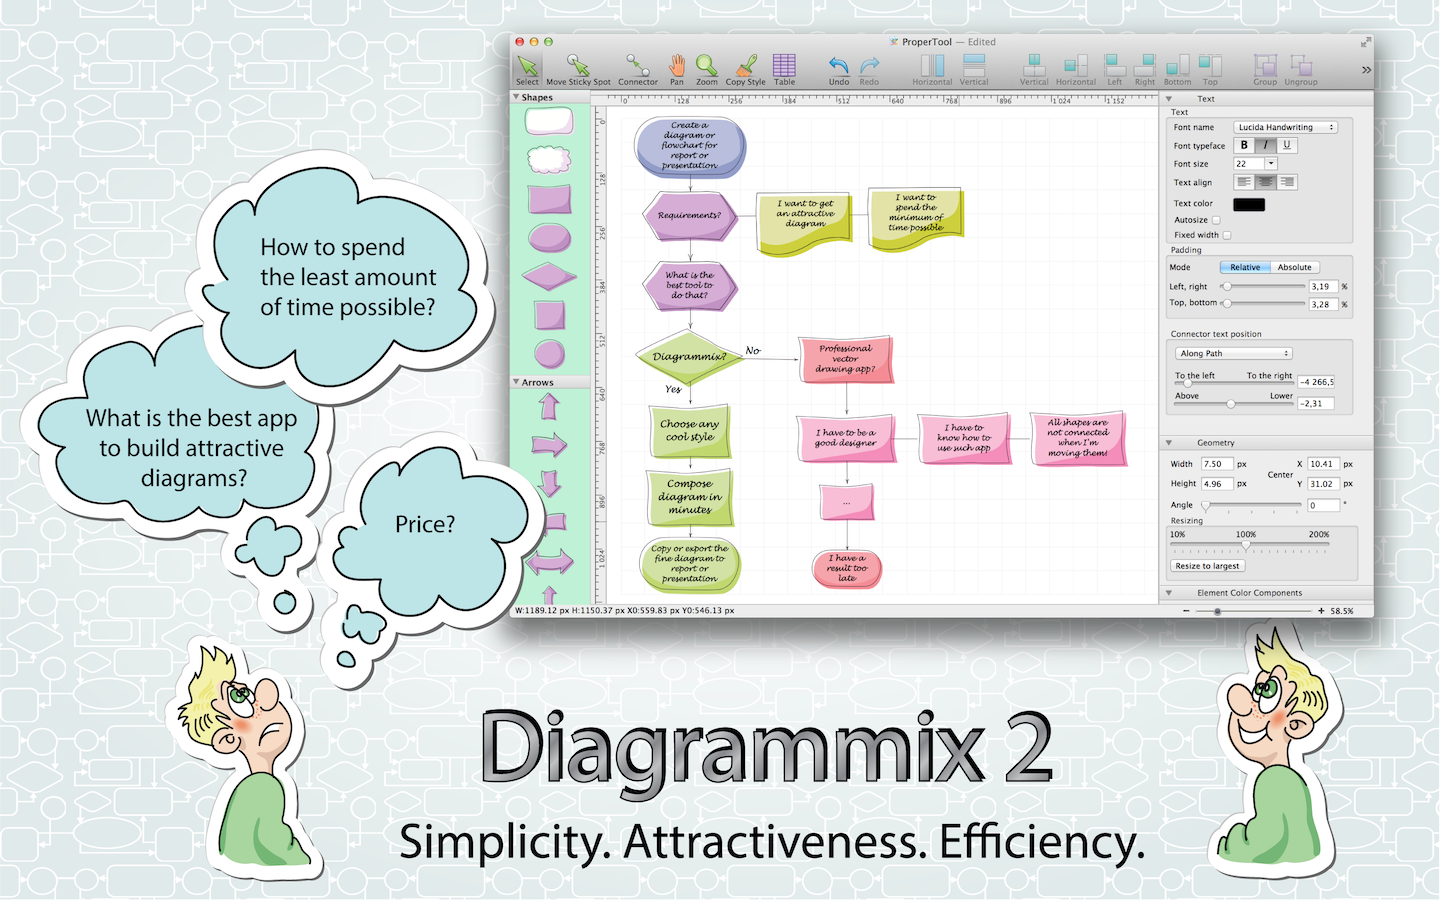
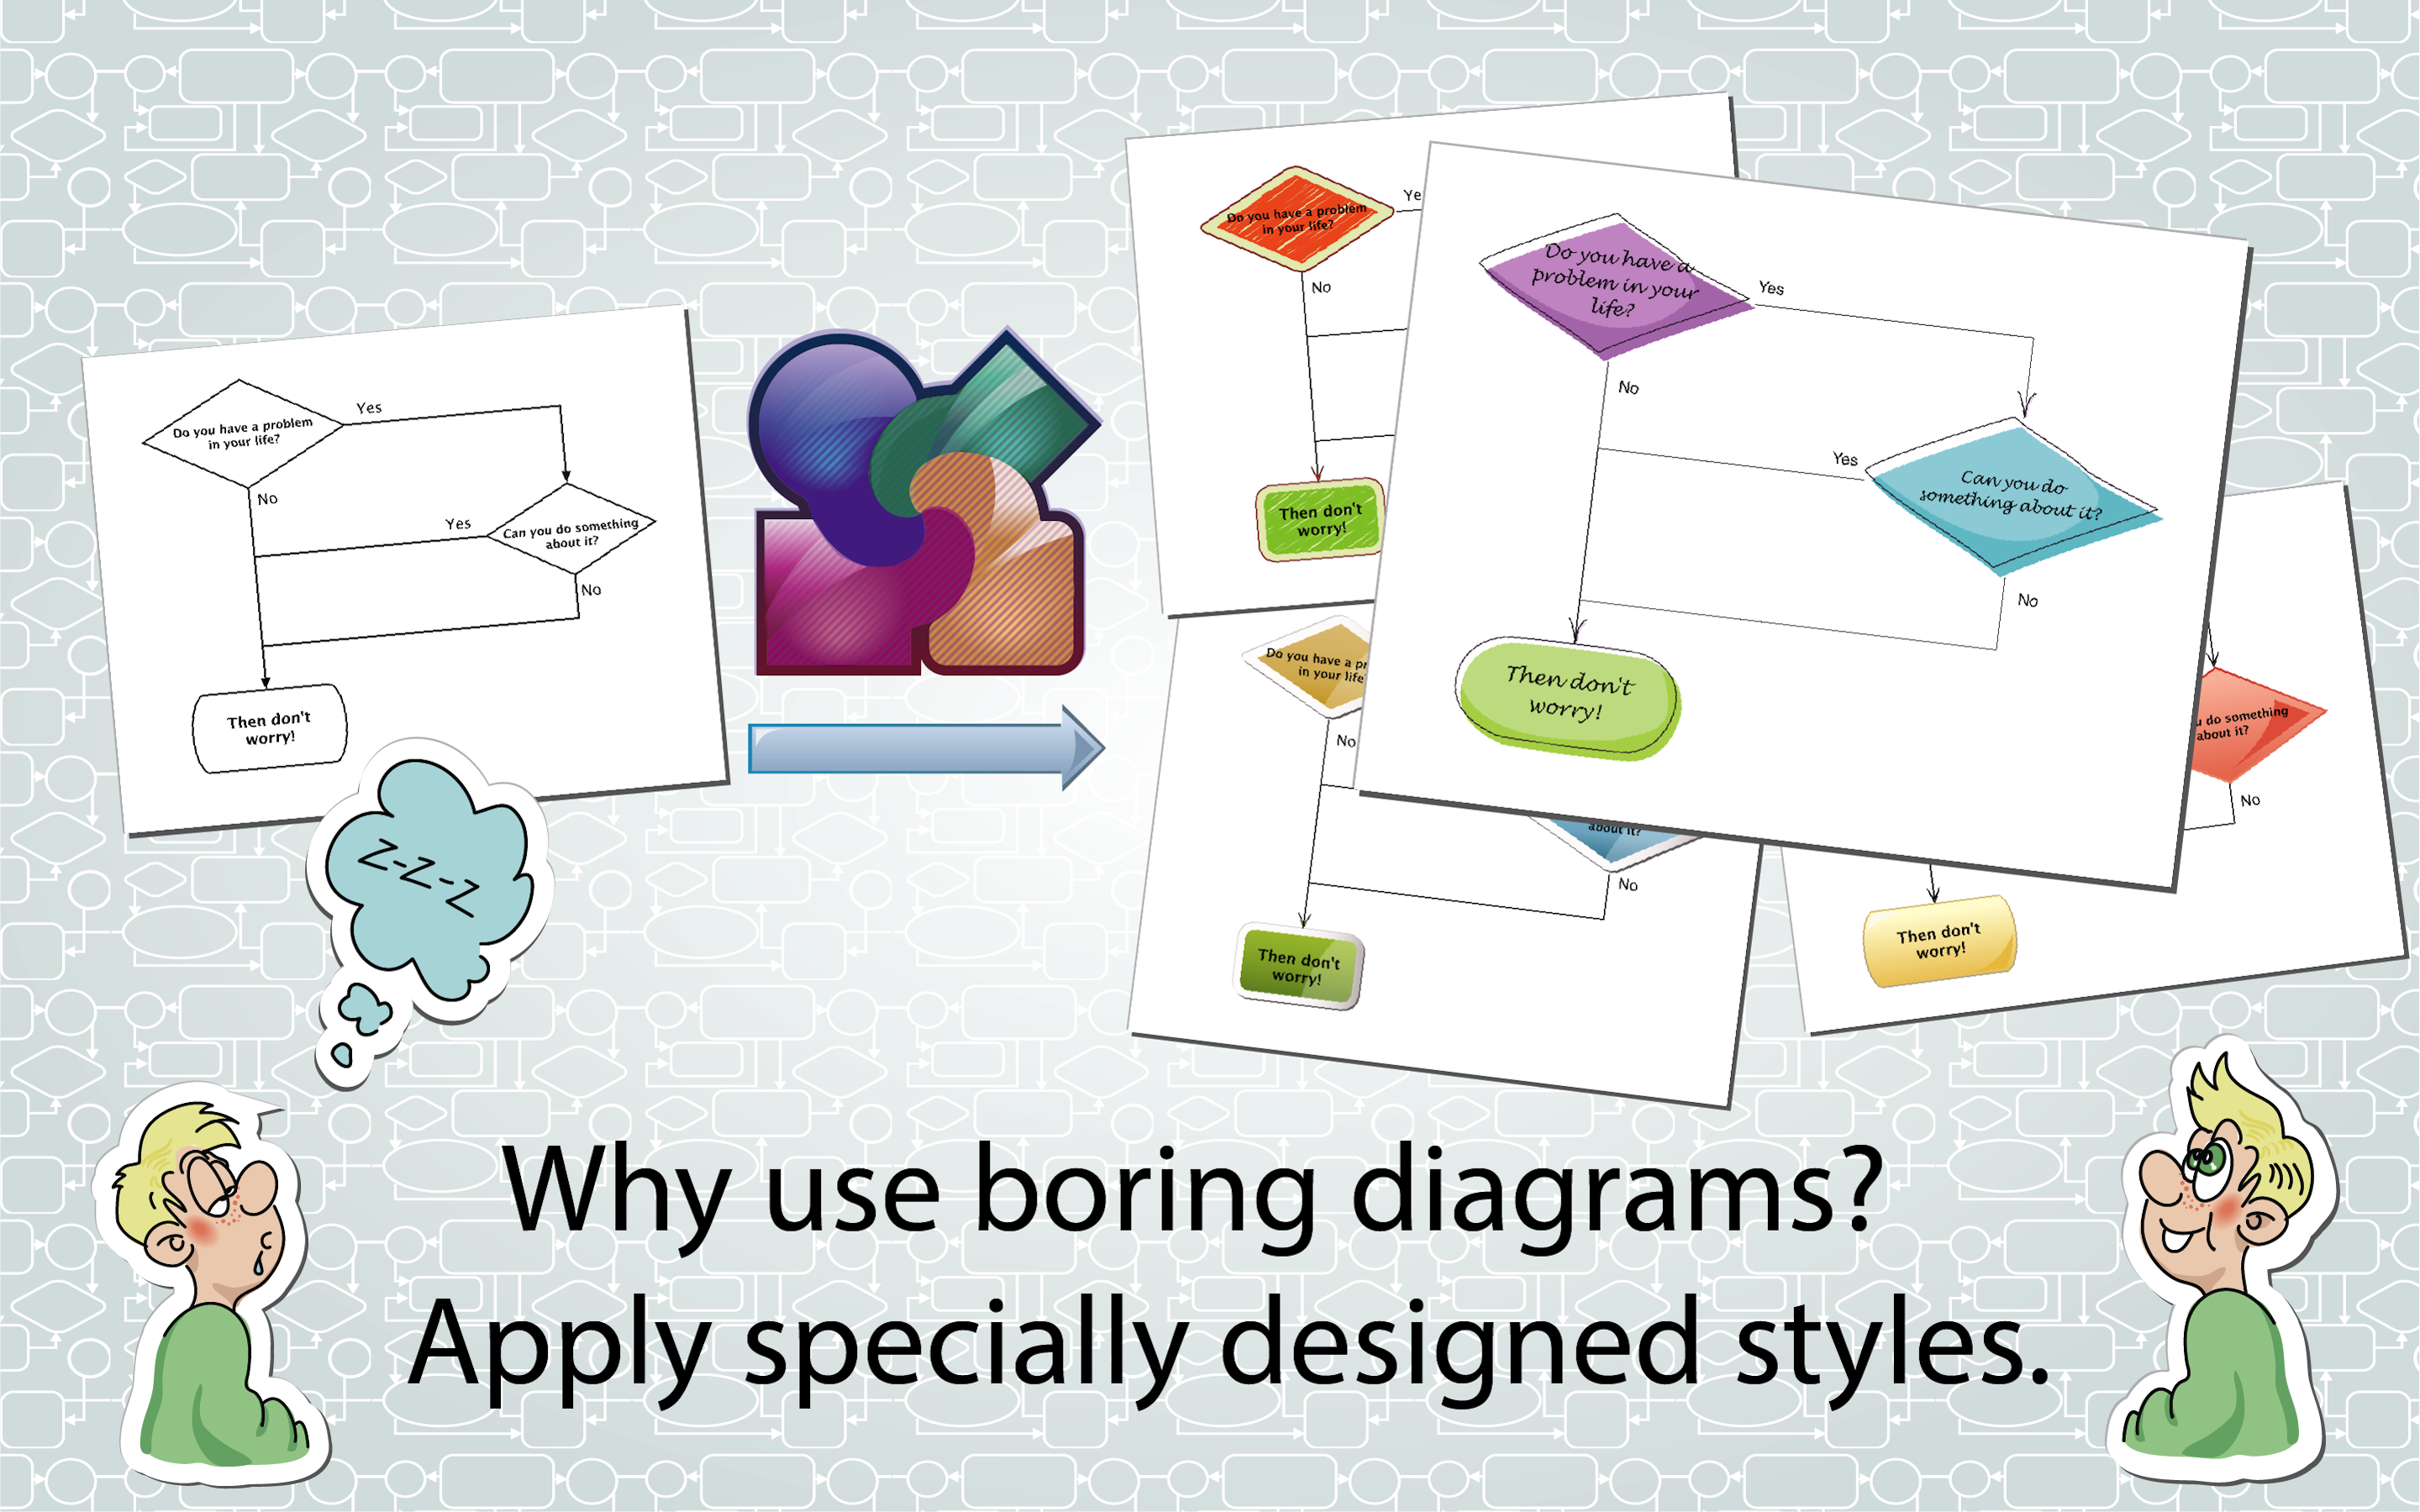
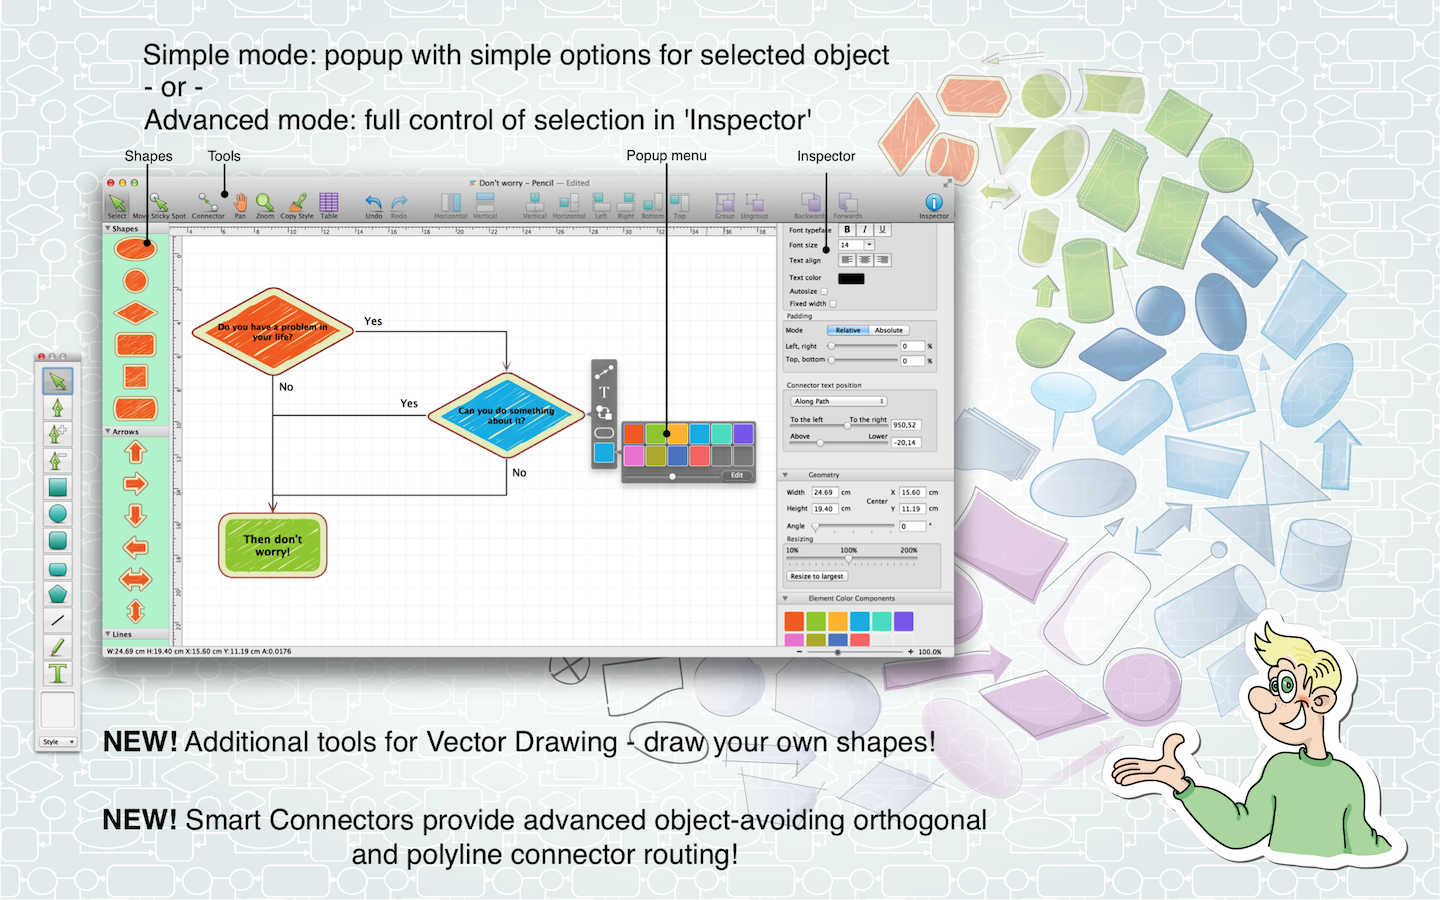
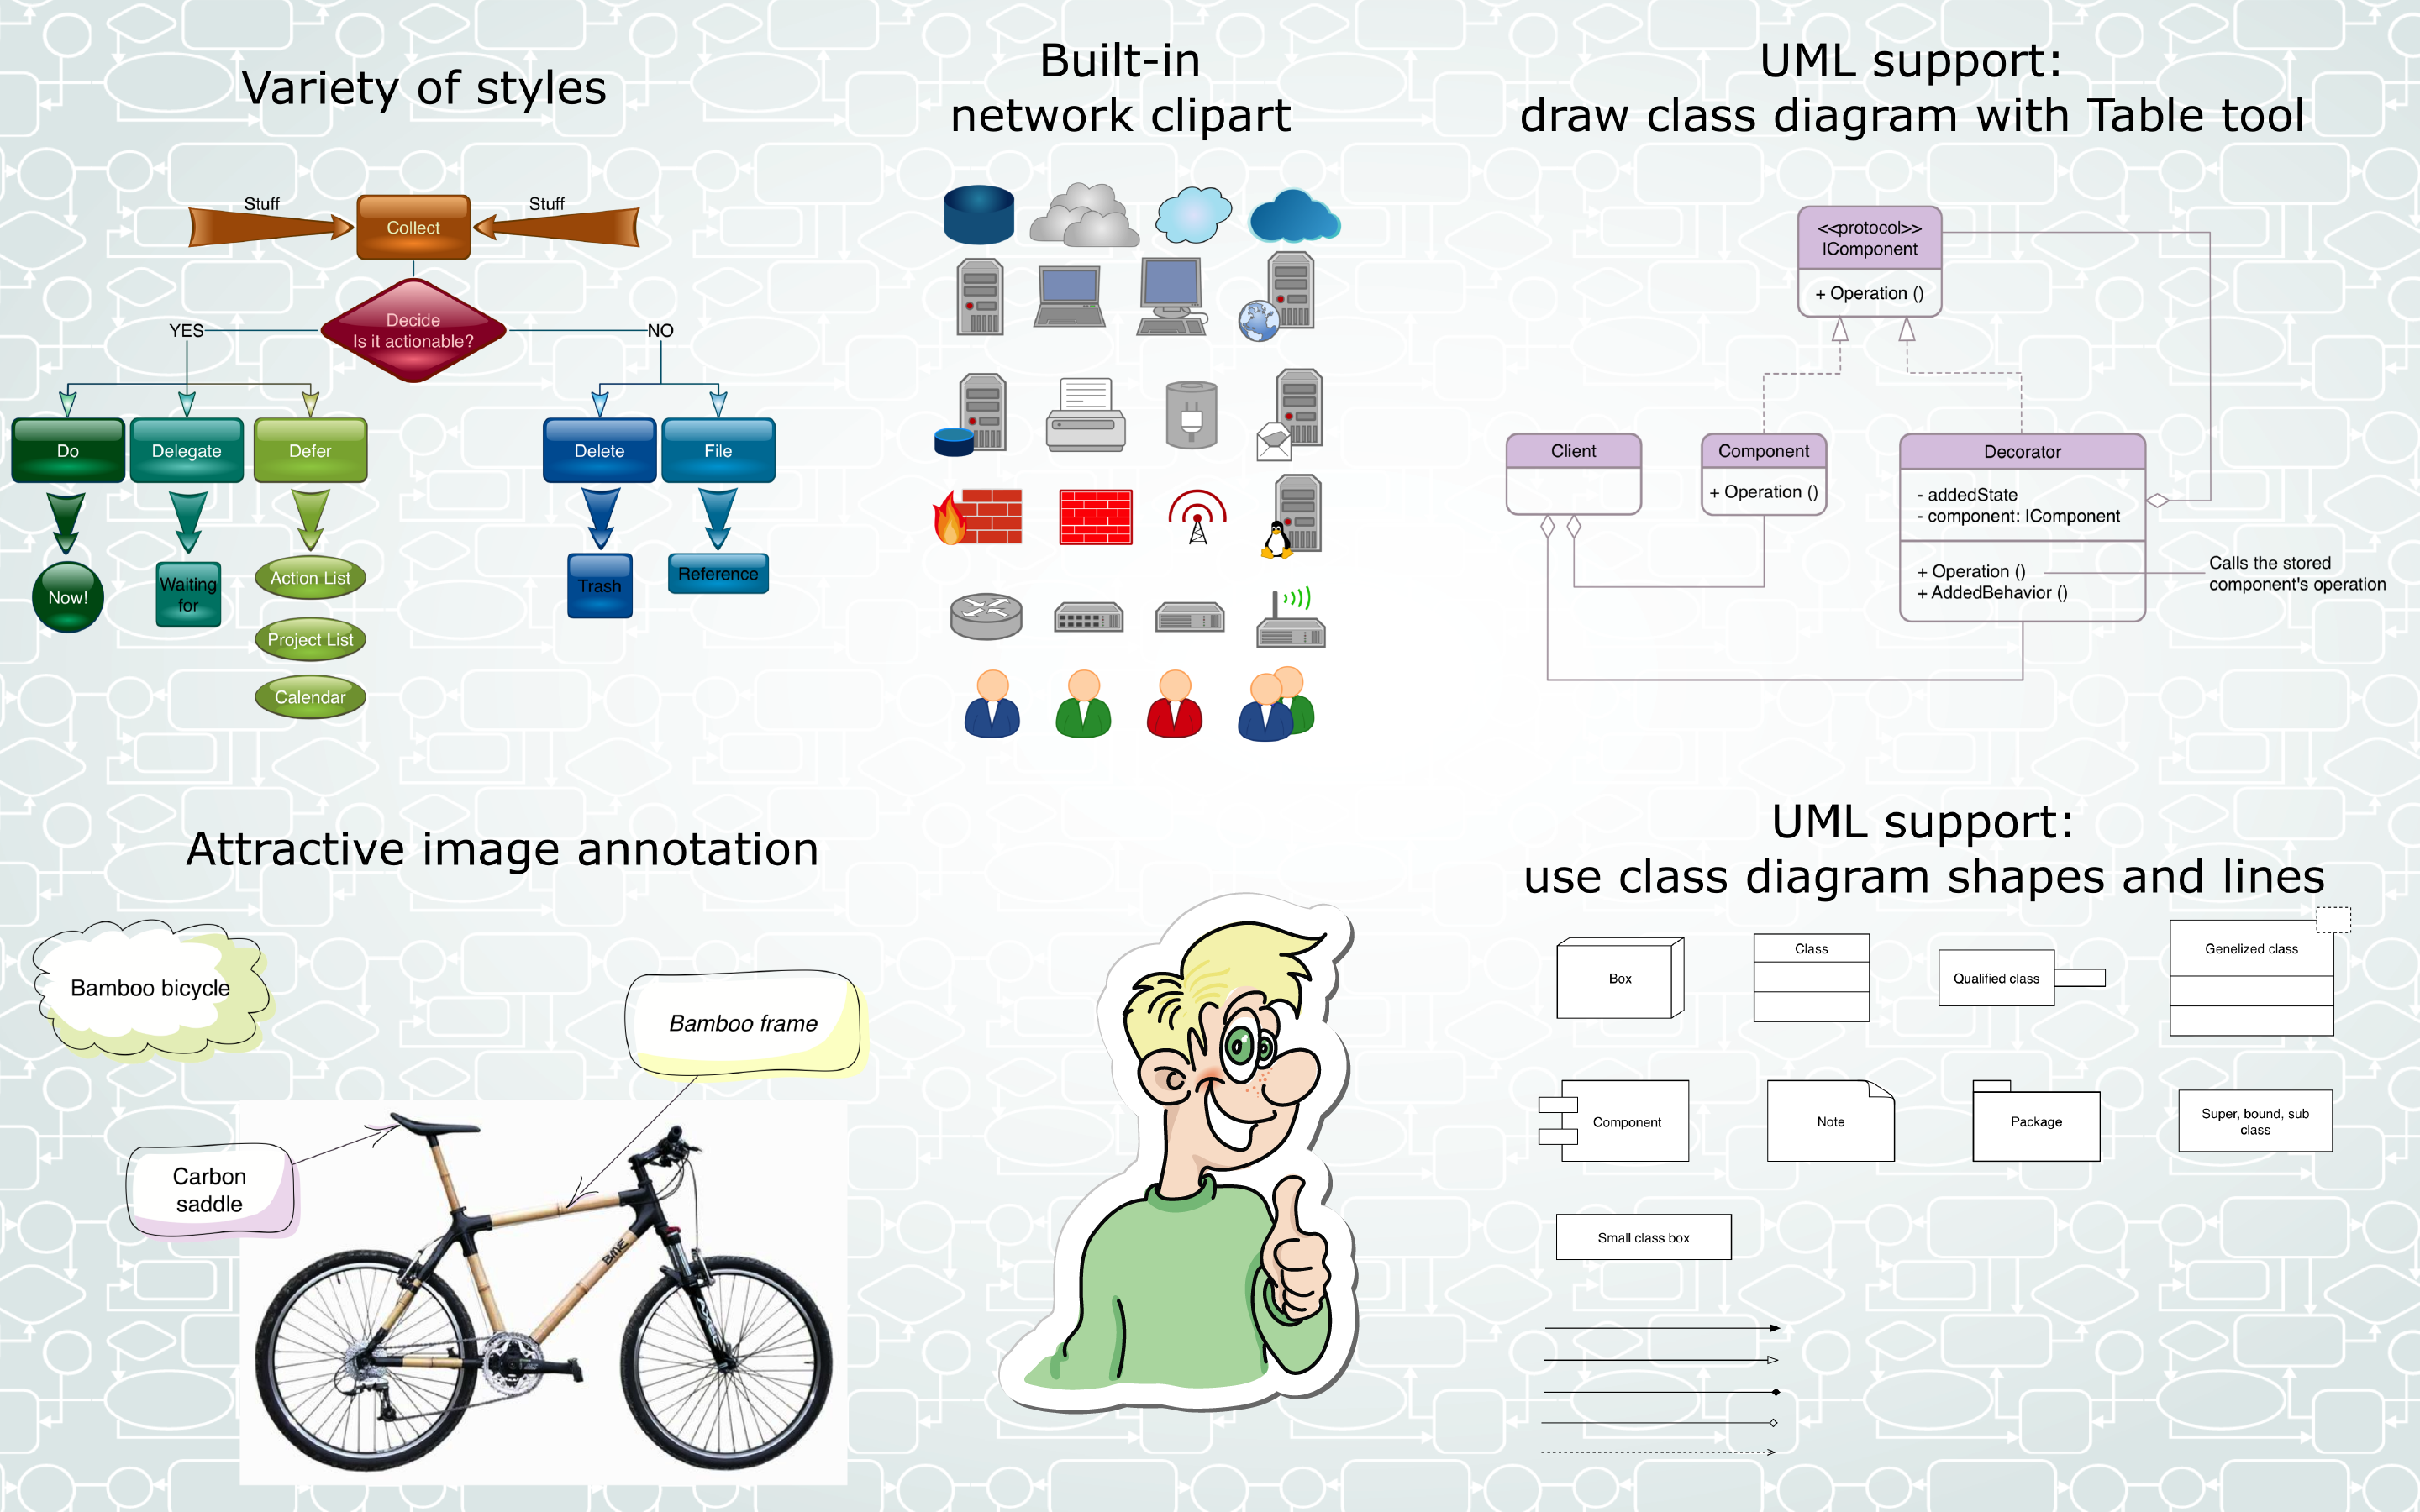
Focus on what really matters: Diagrammix will connect and autosize elements as text is being entered, while also aligning elements and connectors. Pre-packaged with a huge amount of art elements and different connectors, you won’t need to waste time to prepare attractive elements yourself in vector drawing editors. Regularly updated no deposit bonuses for online casinos in 2019. Get new exclusive promo codes and free spins valid for your country.
Just drag and drop elements from the palette, connect them and enter the text you want. You can also drag or paste any image from any other application, and drop it in Diagrammix to make linked annotations.
Your work can be saved in a number of formats, including JPEG, PNG, TIFF, PDF, SVG or copied and pasted into a text processor for further editing.