Create a document with “Command drive” style and type commands into the field. Then click “Build” button or press a shortcut Cmd+R. You can add additional shapes from the palette which will be preserved after rebuild.
| Graph |
graph TD
|
| This statement declares a new graph and the direction of the graph layout. |
- TB – top bottom
- BT – bottom top
- RL – right left
- LR – left right
- TD – same as TB
|
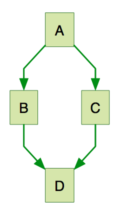
	graph TB;
	    A-->B;
	    A-->C;
	    B-->D;
	    C-->D;
|
 |
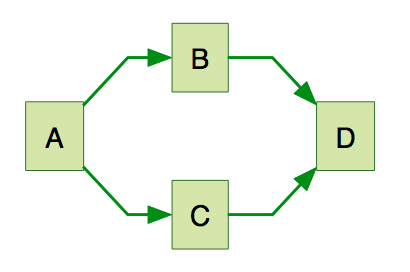
	graph LR;
	    A-->B;
	    A-->C;
	    B-->D;
	    C-->D;
|
 |
|
| A node (default) |
| id1 |
graph TB;
    A
|
 |
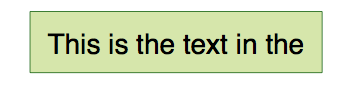
| A node with text |
| id1[This is the text in the box] |
| It is also possible to set text in the box that differs from the id. If this is done several times, it is the last text found for the node that will be used. Also if you define edges for the node later on, you can omit text definitions. The one previously defined will be used when rendering the box. |
graph TB;
    A[This is the text in the box]
|
 |
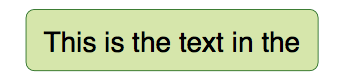
| A node with round edges |
| id1(This is the text in the box); |
graph TB;
    A(This is the text in the box)
|
 |
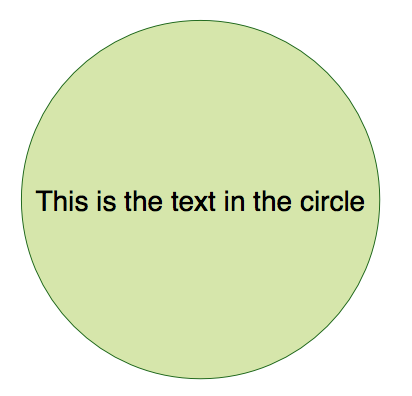
| A node in the form of a circle |
| id1((This is the text in the circle)); |
graph TB;
    A((This is the text in the circle))
|
 |
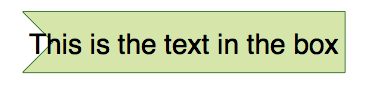
| A node in an asymetric shape |
| id1>This is the text in the box] |
graph TB;
    A>This is the text in the box]
|
 |
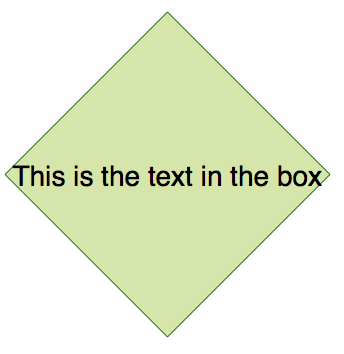
| A node (rhombus) |
| id1{This is the text in the box} |
graph TB;
    A{This is the text in the box}
|
 |
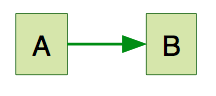
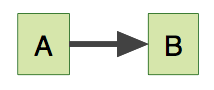
| A link with arrow head |
| A–>B |
graph TB;
    A-->B
|
 |
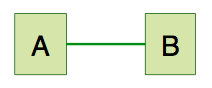
| An open link |
| A — B |
graph TB;
    A---B
|
 |
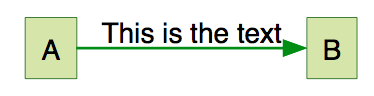
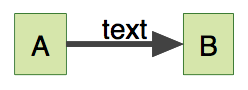
| Text on links |
| A– This is the text — B |
| or |
| A—|This is the text|B; |
graph TB;
    A-- This is the text --- B
|
 |
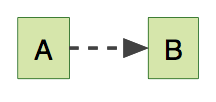
| Dotted link |
| -.-> |
graph TB;
    A-.->B
|
 |
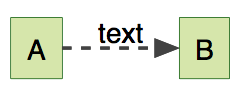
| Dotted link with text |
| -. text .-> |
graph TB;
    A-. text .->B
|
 |
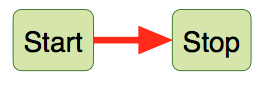
| Thick link |
| ==> |
graph TB;
    A==>B
|
 |
| Thick link with text |
| == text ==> |
graph TB;
    A== text ==>B
|
 |
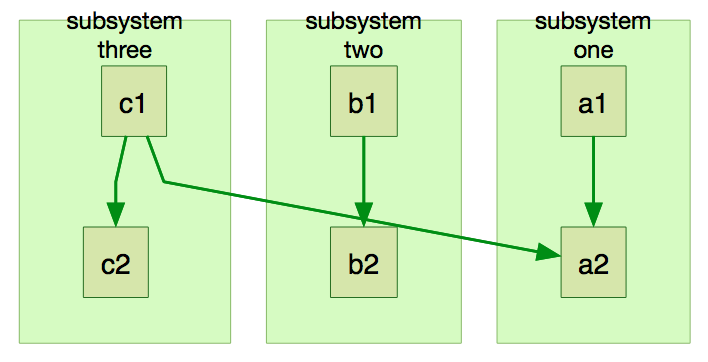
| Subgraphs |
subgraph title
graph definition
end |
graph TB
        subgraph subsystem one
        a1-->a2
        end
        subgraph subsystem two
        b1-->b2
        end
        subgraph subsystem three
        c1-->c2
        end
        c1-->a2
|
 |
| Styling links |
| linkStyle 3 stroke:#ff3,stroke-width:4px; |
| It is possible to style links. For instance you might want to style a link that is going backwards in the flow. As links have no ids in the same way as nodes, some other way of deciding what style the links should be attached to is required. Instead of ids, the order number (starting from 0) of when the link was defined in the graph is used. In the example below the style defined in the linkStyle statement will belong to the fourth link in the graph |
graph LR
    id1(Start)-->id2(Stop);
    linkStyle 0 stroke:#ff0000,stroke-width:4px;
|
 |
| Styling a node |
graph LR
    id1(Start)-->id2(Stop)
    style id1 fill:#f9f,stroke:#333,stroke-width:4px;
    style id2 fill:#ccf,stroke:#f66,stroke-width:2px,stroke-dasharray: 5, 5;
|
 |
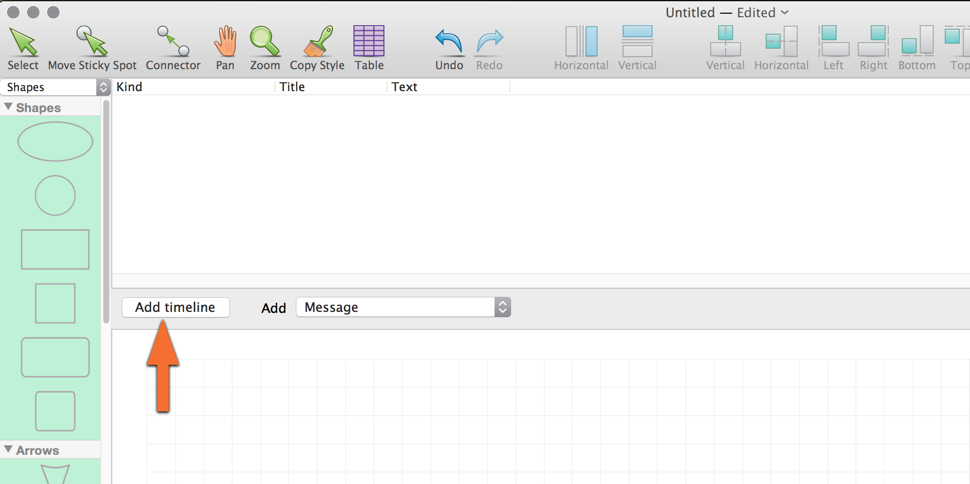
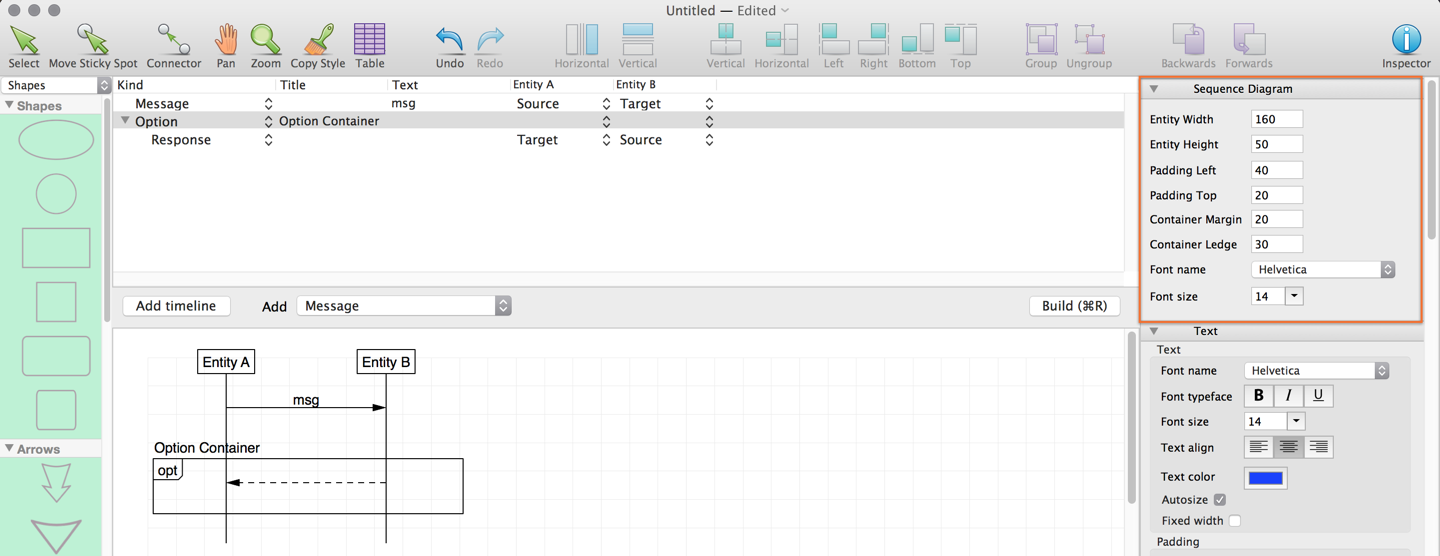
First create a document with “UML Sequence” style (see also below a command driven way to create sequence diagrams).
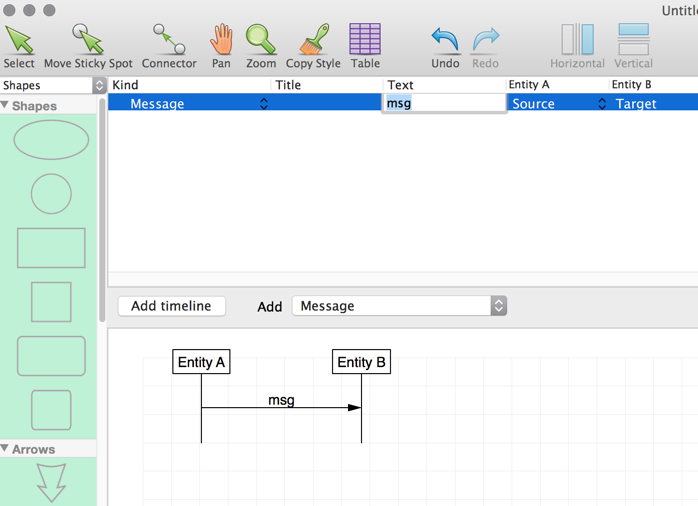
The editor for sequence diagrams consists of 2 parts: an outline and graphic image. How to create a sequence diagram.
1. Create two or more timelines:
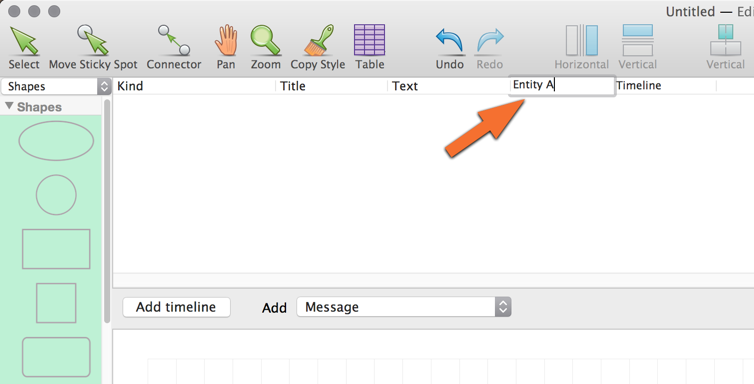
2. Double click a timeline caption to rename it:
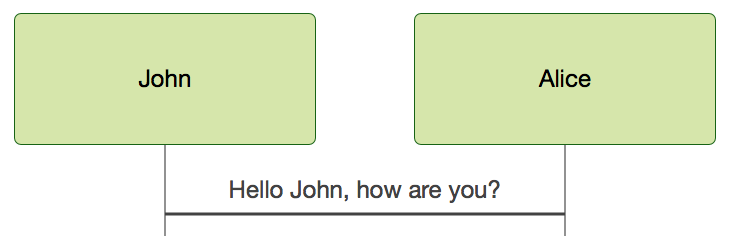
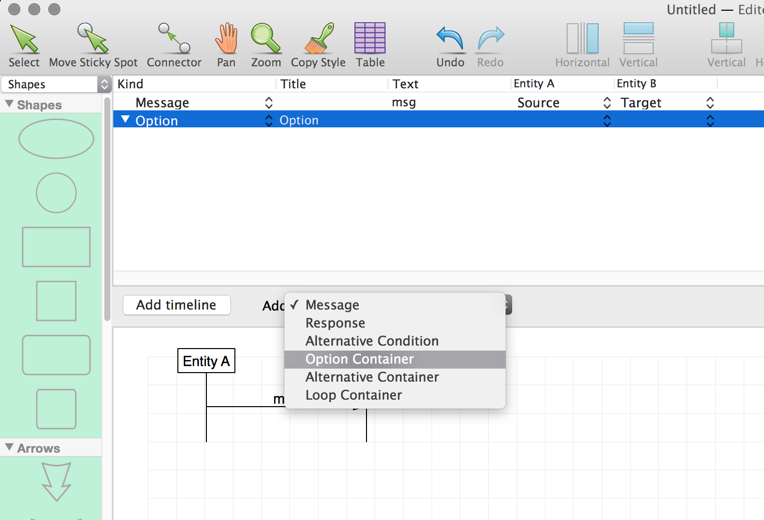
3. Right-click a sequence area to add a message:
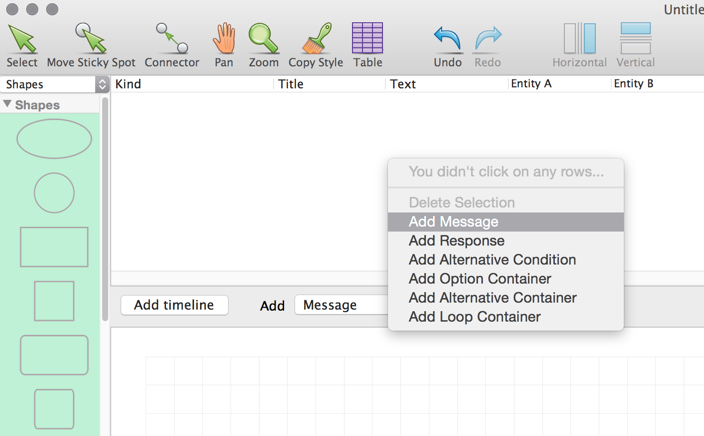
(or select Add Message from the drop down menu).
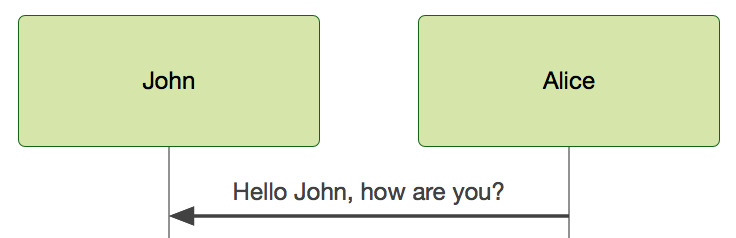
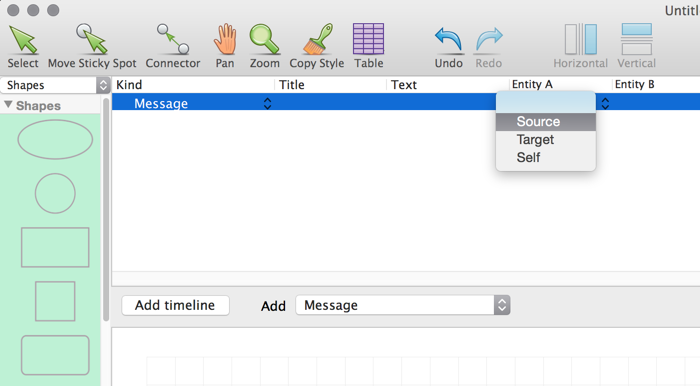
4. Select where the source and target are:
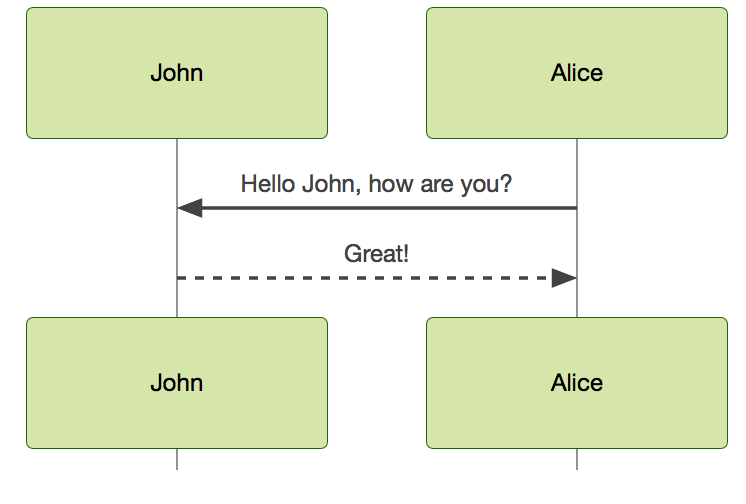
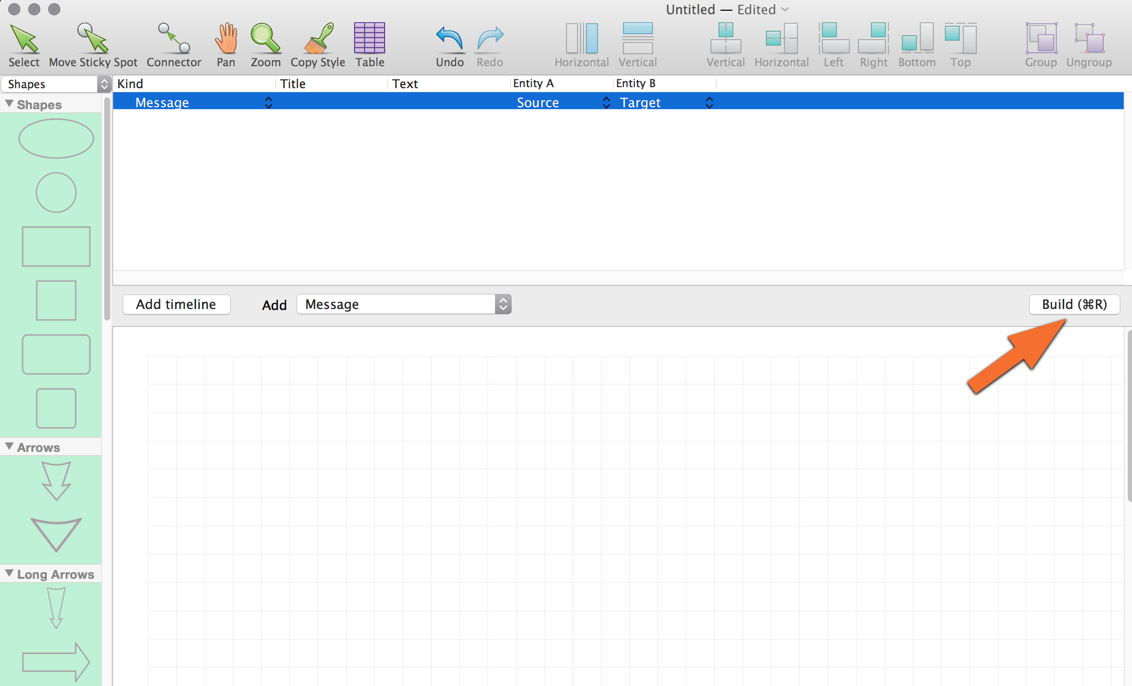
5. Build the diagram (Cmd+R):
6. Double click a Text cell to add a message:
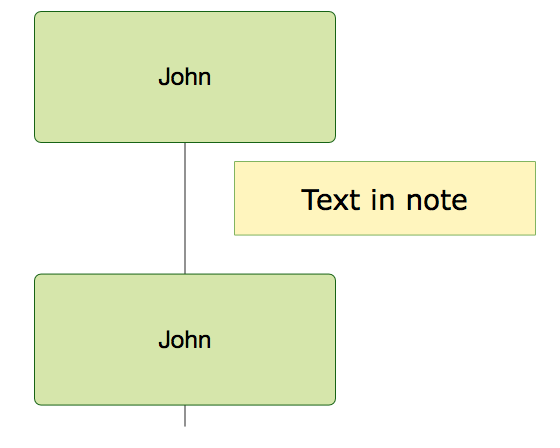
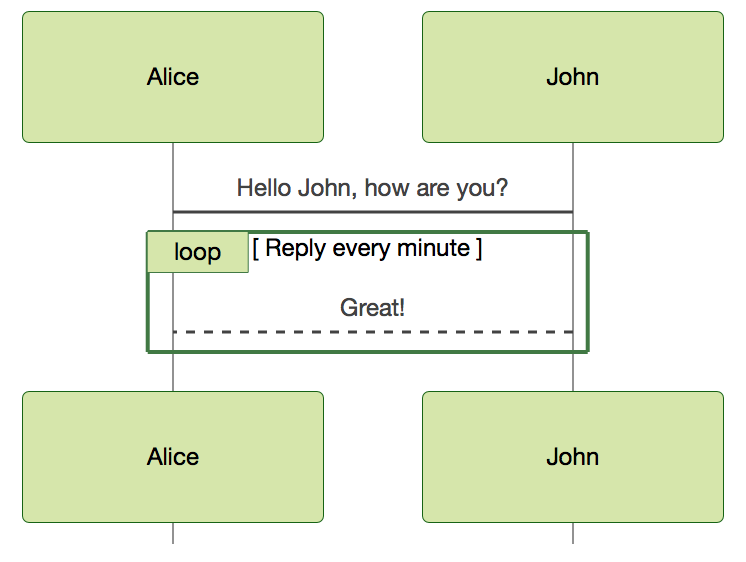
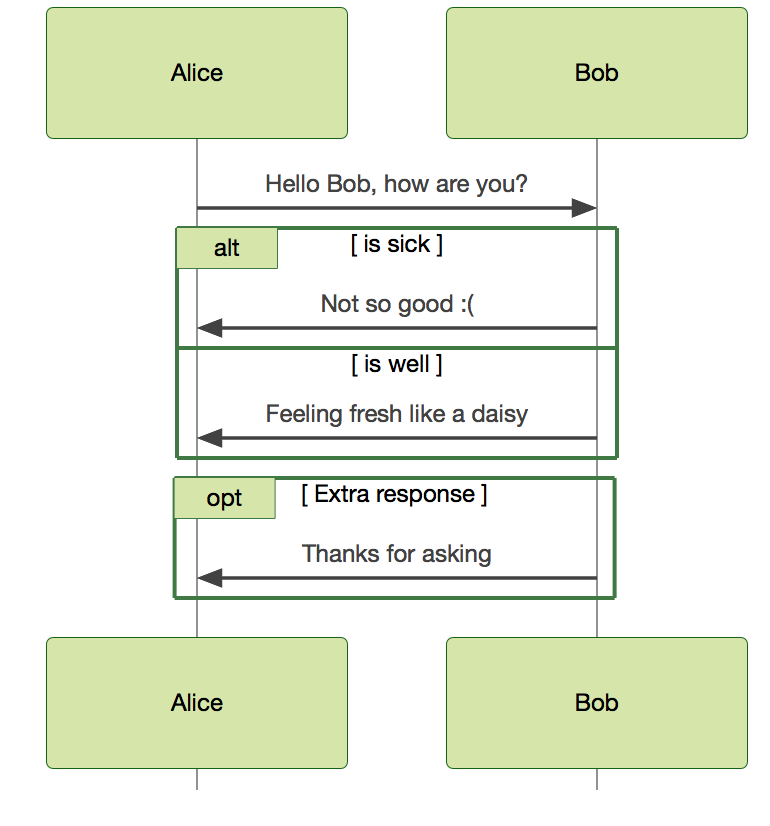
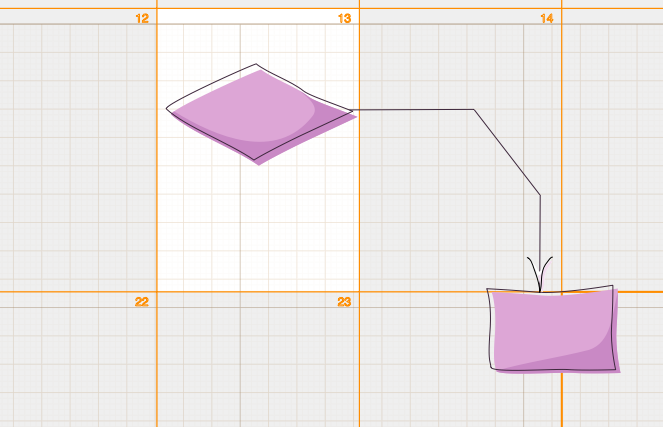
Then you can add other messages or containers:
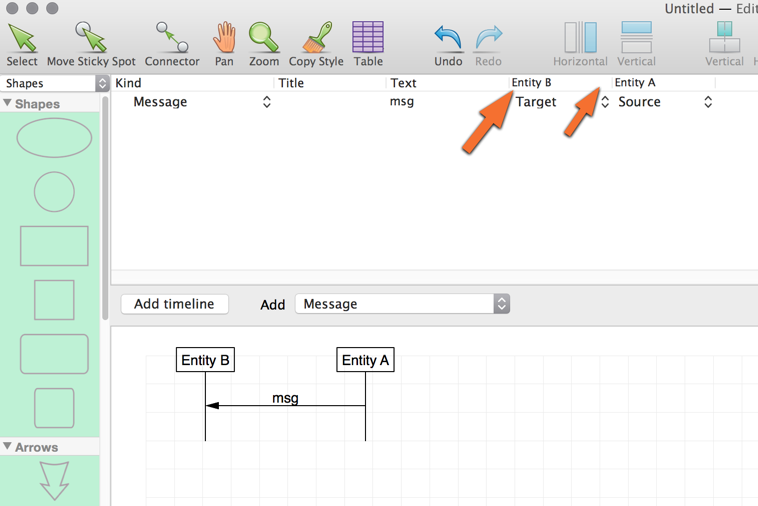
Drag messages to drop it into a container or change the order. Rebuild the diagram to see result. You can also drag and drop timeline columns:
For containers you can change a title:
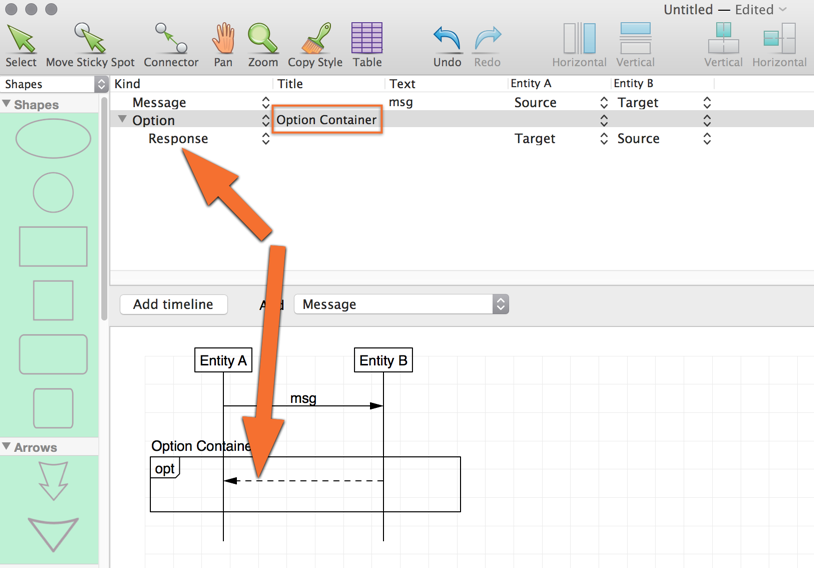
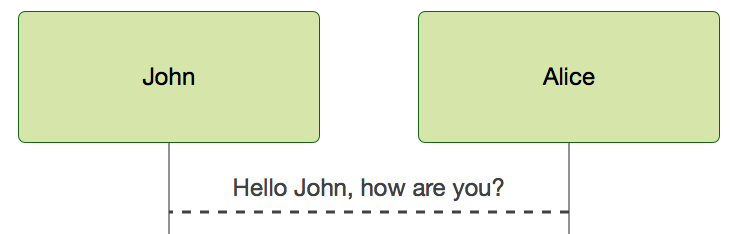
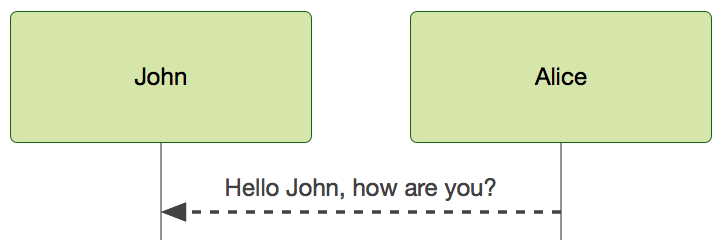
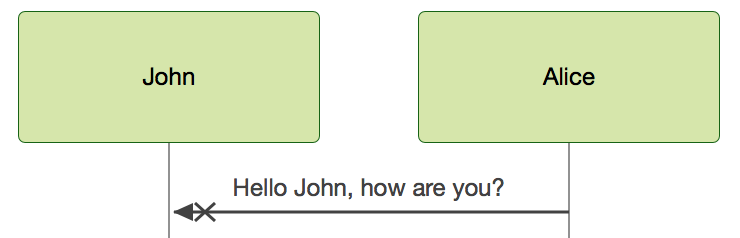
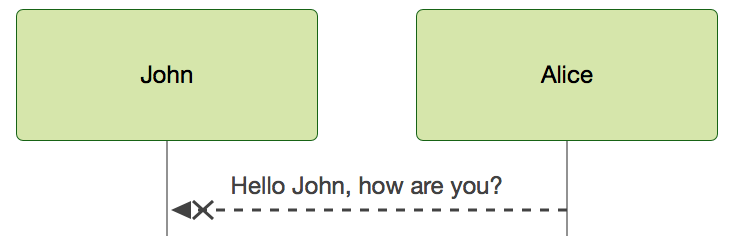
There is also an option to switch between message and response.
You can change visual properties of a diagram as usual and they will be kept after re-build. See some Preferences in the Inspector:
There is an additional component “Smart connectors” that provides advanced object-avoiding orthogonal and polyline connector routing. This component available as in-app purchase both for Mac App Store and non App Store version of the app. See menu Store inside the app.
There is an additional component “Vector Drawing Tools” that allows you to create your own shapes and lines and use them along with predefined shapes. In fact this is a vector drawing editor inside Diagrammix! This component available as in-app purchase both for Mac App Store and non App Store version of the app. See menu Store inside the app.
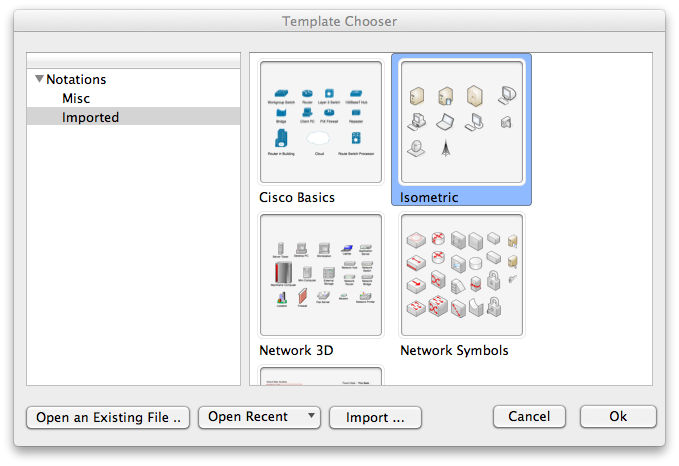
You can import stencils from Graffletopia.com. Import option is located on the Template Chooser (File – New or Cmd + N).
You can also import stencils into the current document (File – Import). Unnecessary imported groups could be removed from the palette. Right click on the group caption and click Delete menu item.
After import you can edit imported elements. Drag element from the palette, ungroup it one or more times (Cmd+Shift+G), edit, group again or group as element (Object – Group as element, Cmd+Shift+E) if you need connectable element, drag result back to the palette.
Imported elements will be added to the derived template based on Customizable Style.
New document with all imported elements will be created after import to check results.
Files with imported elements are located in the “~/Library/Application Support/Diagrammix/Notations/Imported/”. To remove imported stencil right click icon on the Style chooser panel and click Delete menu item.
Please, report about probable problems with import. We are currently improving this feature, but many stensils are imported without problems. Try it.
You can export Diagrammix drawings to these formats:
– PDF,
– PNG,
– JPEG,
– TIFF
and SVG (File > Export as SVG).
When you export a drawing using the Export dialog box (File menu), an Export the Drawing dialog box may appear, in which you can specify settings for the exported file. If necessary, you can crop exported images to visible objects bounds, specify background transparency (PNG, TIFF). Resolutions from 72 dpi to 300 dpi are available.
In Diagrammix, the drawing size and printer paper size are set separately. You can set a drawing page size that is the same as, larger than, smaller than, or has a different orientation from the printer paper. The drawing page size is set in the Preferences – Units & Grid section. You can select one of the predefined drawing size or set any drawing size.
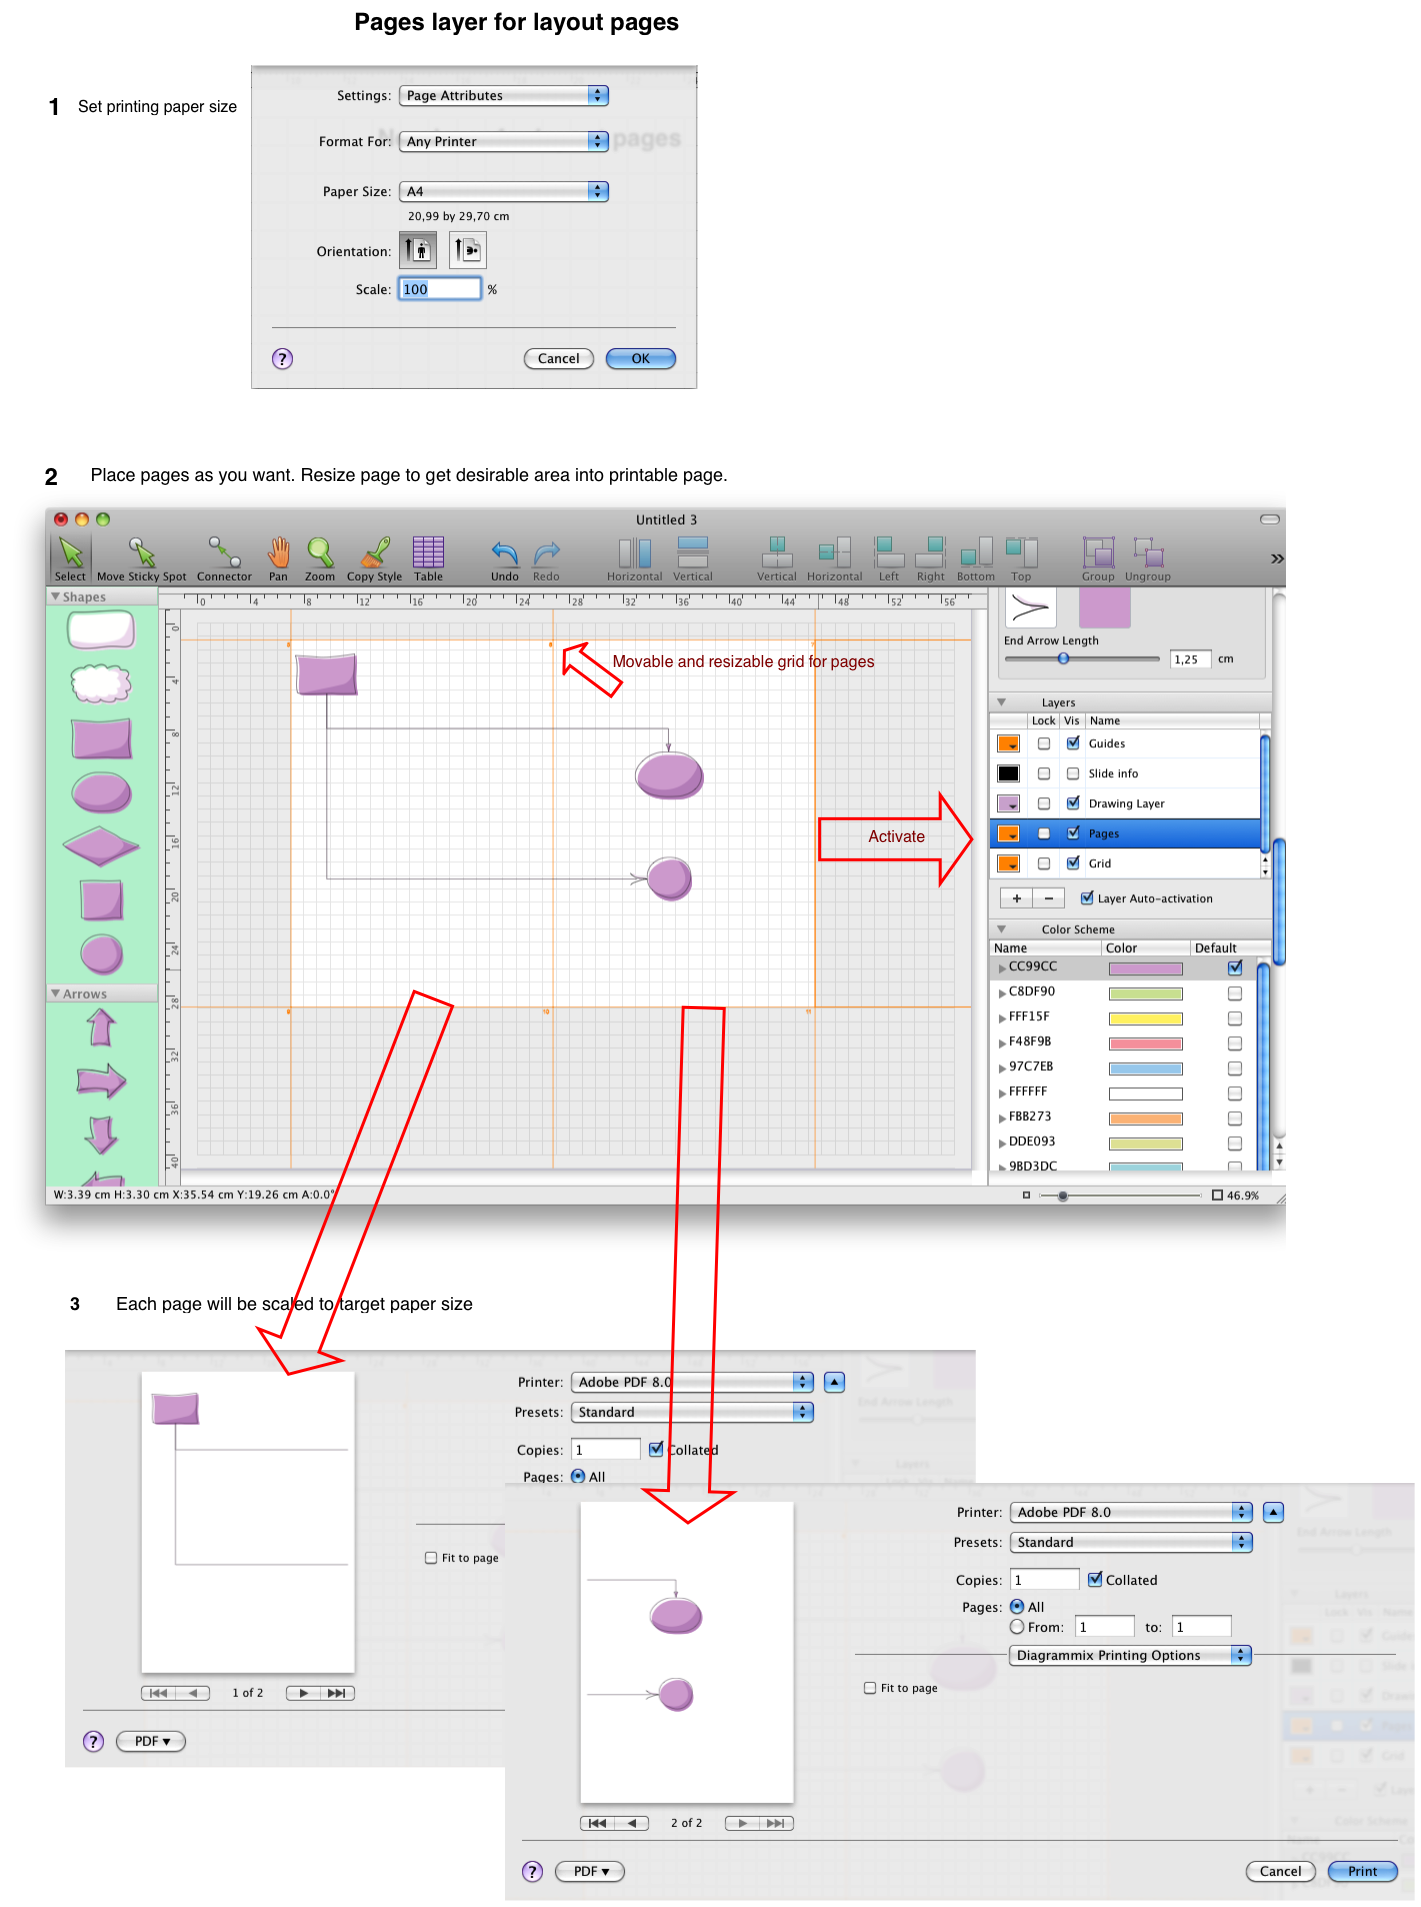
You can change the printer paper size in the File – Page setup dialog.
There is special layer Pages (Layer – Layers Palette) to show pages layout. You can move the grid of pages and resize each page. After resizing each page will be scaled to the size of printer paper.
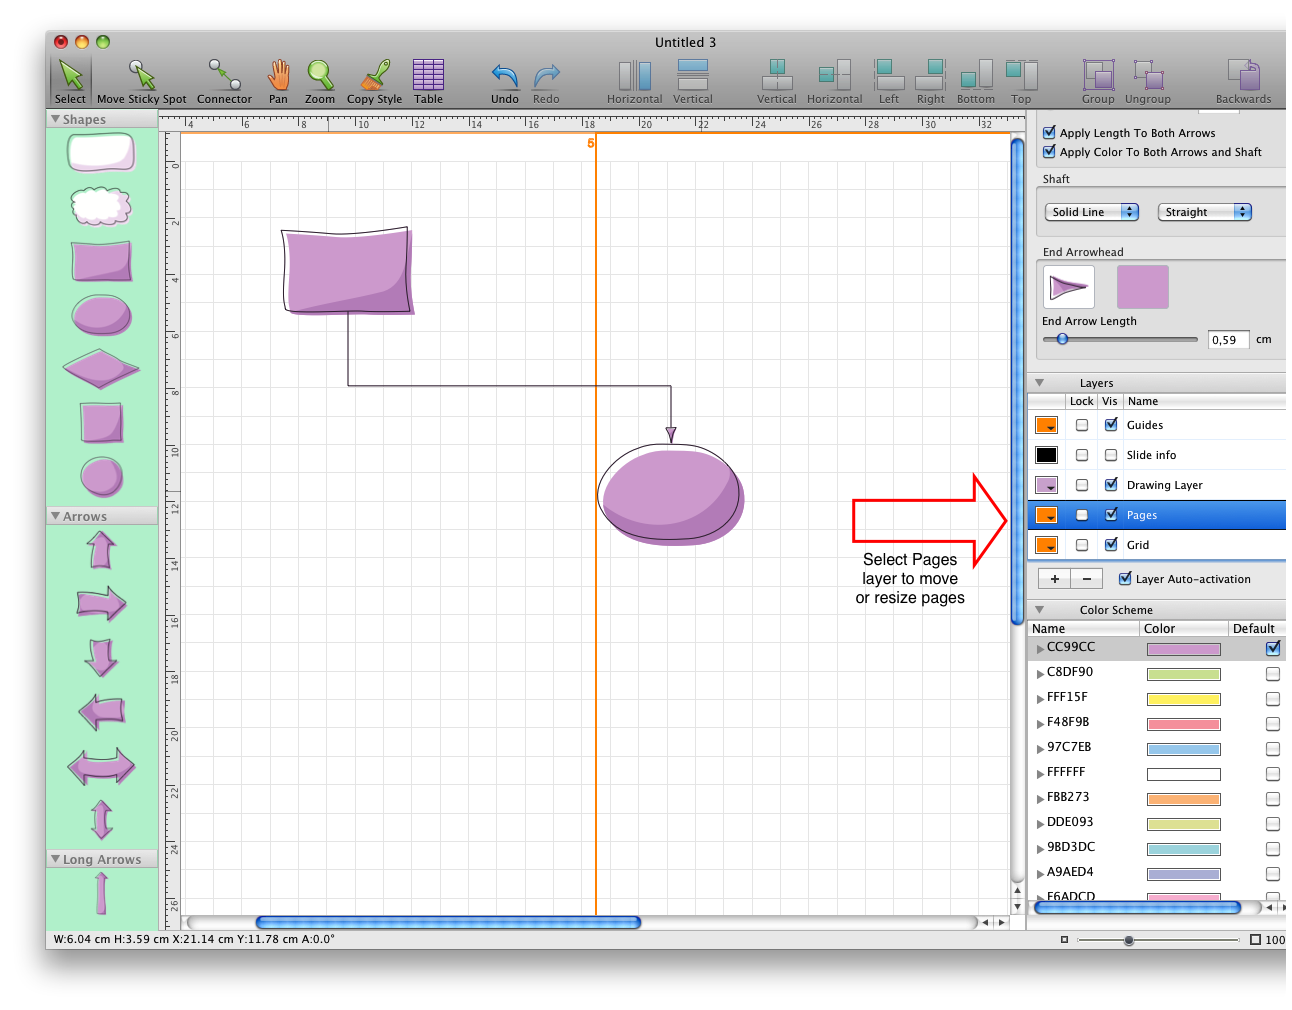
All process is shown on the next picture:
Right click on the Pages layer to show context menu with commands “Reset pages layout”, “Add page to the printing range”, “Remove page from the printing range”.
Click with Cmd to add (or remove) current page to the printing range.
With this feature you can easily print just what you need with scaling to the target paper size:
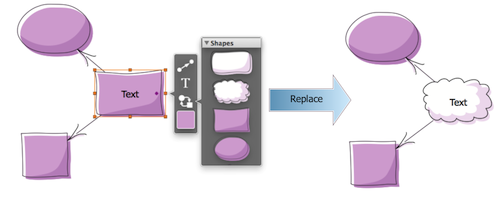
You can change shape into another shape. Text and connectors are preserved.
You can access an element’s, connector’s, table’s properties via Inspector. After you have a selection, you can perform operations on the selected objects, similar to the actions you can perform in a popup windows.